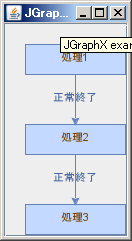
GroovyとJGraphXを使用してフロー図を描画するには、以下のコードを実行します。
import javax.swing.*
import groovy.swing.*
import com.mxgraph.swing.*
import com.mxgraph.view.*

def graph = new mxGraph()
parent = graph.getDefaultParent()

graph.model.beginUpdate()
try
{
  def v1 = graph.insertVertex(parent, null, "処理1",
    20, 20, 100, 30)
  def v2 = graph.insertVertex(parent, null, "処理2",
    20, 100, 100, 30)
  def v3 = graph.insertVertex(parent, null, "処理3",
    20, 180, 100, 30)
  graph.insertEdge(parent, null, "正常終了", v1, v2)
  graph.insertEdge(parent, null, "正常終了", v2, v3)
}
finally
{
  graph.model.endUpdate()
}


sb = new SwingBuilder()
sb.frame(
  title: "JGraphX example1",
  visible: true,
  pack: true,
  resizable: true,
  defaultCloseOperation: WindowConstants.EXIT_ON_CLOSE
){
  widget( new mxGraphComponent(graph) )
}
実行結果

関連情報
JGraphxのダウンロードページ
 関連情報
JGraphxのダウンロードページ
関連情報
JGraphxのダウンロードページ

